On February 2022 Google announced a big Looker Studio update. This update had a major impact on the way we blend multiple data sources. The biggest change? Now we can choose from five different “join operators”, instead of just one. First let me describe how data blending in Google Looker Studio works, before getting deeper into the material.
Blended data sources are very useful in almost every dashboard with different data sources. Basically this is just a way to create scorecards, tables and/or graphs with data from multiple sources. A blended data source is built up like the image below.
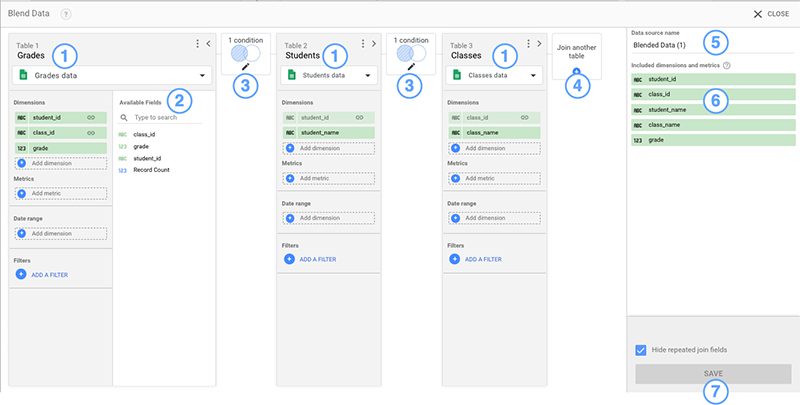
Legend blended data source (above image):
- Tables; a table can be seen as a data source, like Google Analytics or a Google Sheet. We can create five different tables, this means that it is possible to blend up to five data sources.
- Available fields list; here we can see the fields (or dimensions and statistics) which we can add into the blended data source we are creating.
- Join configuration; here we can set up how the different tables are connected. With the help of so called “join operators” we can connect the tables to each other. More about this later.
- Join another table; here we can add a new table (source).
- Data source name; here we can give the blended data source a relevant name.
- Included dimensions and metrics; the complete list of dimensions and metrics we can use in the blended data source.
- Save button
Data blending in Google Looker Studio: the tricky thing
As mentioned in the first paragraph Google lately introduced new features in Data Studio. The biggest upgrade is the option “Join configuration” (see point 3 in the image with the visualisation of a blended data source). This upgrade is a tricky one, because it creates incomplete data when used wrong.
The functions and differences of the four most used join operators are explained below.
The left join operator
The “left join operator” used to be the only possible join operator in Google Looker Studio. With this option Looker Studio is returning all the rows of the left table and the matching rows of the right table. A practical example is given below. In this example the dimension “date” is used to connect the sources Facebook and LinkedIn Ads.
As mentioned: all the rows of the left source (Facebook Ads) are visible in the table. But the dates 8 and 9 March (see table LinkedIn Ads) are not visible in the table. The reason: these dates are not matching with the rows of the Facebook Ads source.

Is the left join operator useful?
If the left join operator creates incomplete data, why does this option even exists? This is a question we heard frequently. Let me give you an inspirational example why the left join operator can be useful:
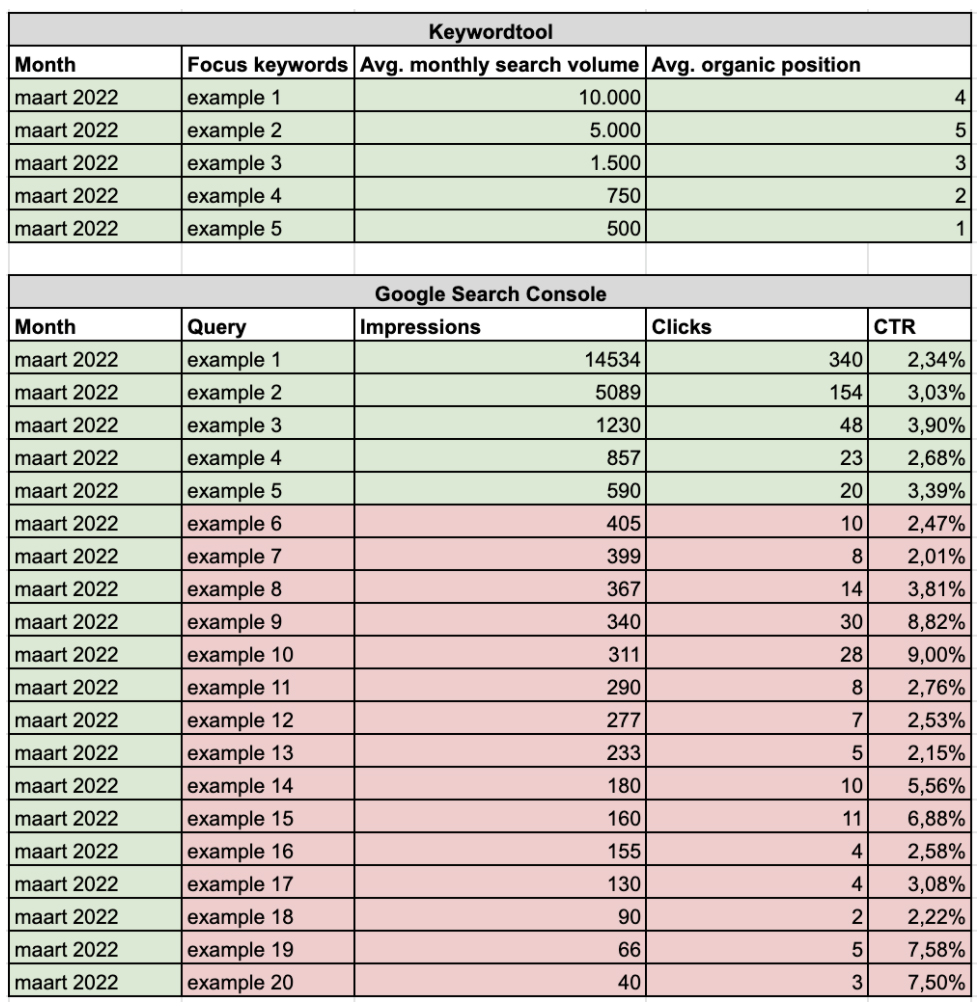
Let’s say we want to monitor the organic Google positions of five different focus keywords in Google Data Studio. We’re using (for example) the software Accuranker to do this (also check out the “Keyword rankings in Google Looker Studio” blog). Besides the organic positions, we also want to see the “Impressions”, “Clicks” and “CTR rate” for the five focus keywords only. We can get these metrics from the Google Search Console connector.
The problem with Google Search Console is that this tool often shows many more keywords besides our five focus keywords. The image below visualizes the situation, we don’t want to show the queries with a red background in Google Data Studio.
To solve this ‘problem’ we can use the left join operator (see the image below). With this set up Google Looker Studio returns all the rows from the left table (Accuranker) and the matching rows of Google Search Console.
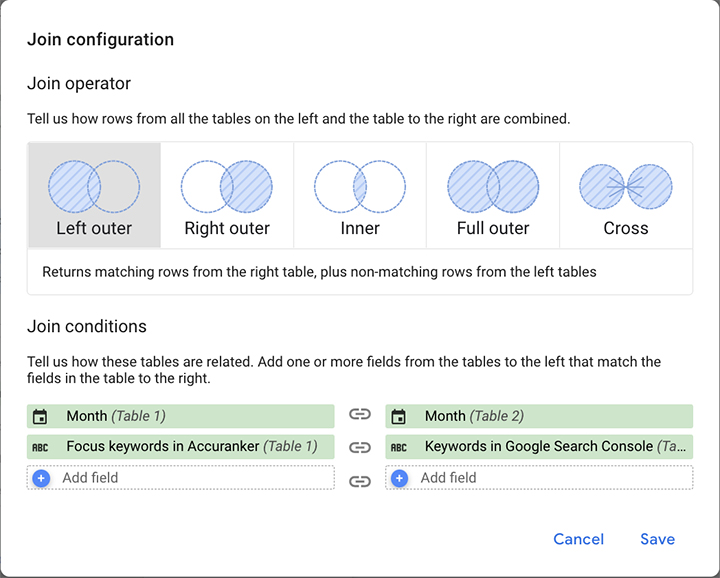
This way we can create clean and functional charts that are combining statistics from Accuranker and Google Search Console.

The right join operator
The right join operator works in an opposite way as the left join operator. Looker Studio is now returning all the rows of the right table and the matching rows of the left table. In this example the dimension “date” is again used to connect the sources Facebook and LinkedIn Ads.
Now all the rows of the right source (LinkedIn Ads) are visible in the table. But the dates 2 and 7 March (see table Facebook Ads) are not visible in the table. The reason: these dates are not matching with the rows of the LinkedIn source.

The inner join operator
With the inner join operator Looker Studio returns only the matching rows of the left and right tables. In our example only 1, 3, 4, 5 and 6 March occur in both sides. This is the reason why Google Looker Studio only shows these dates in the table.

The full outer join operator
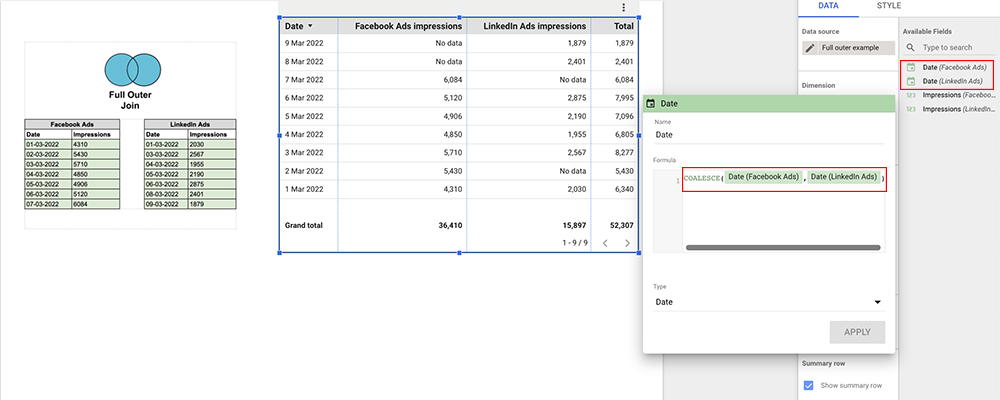
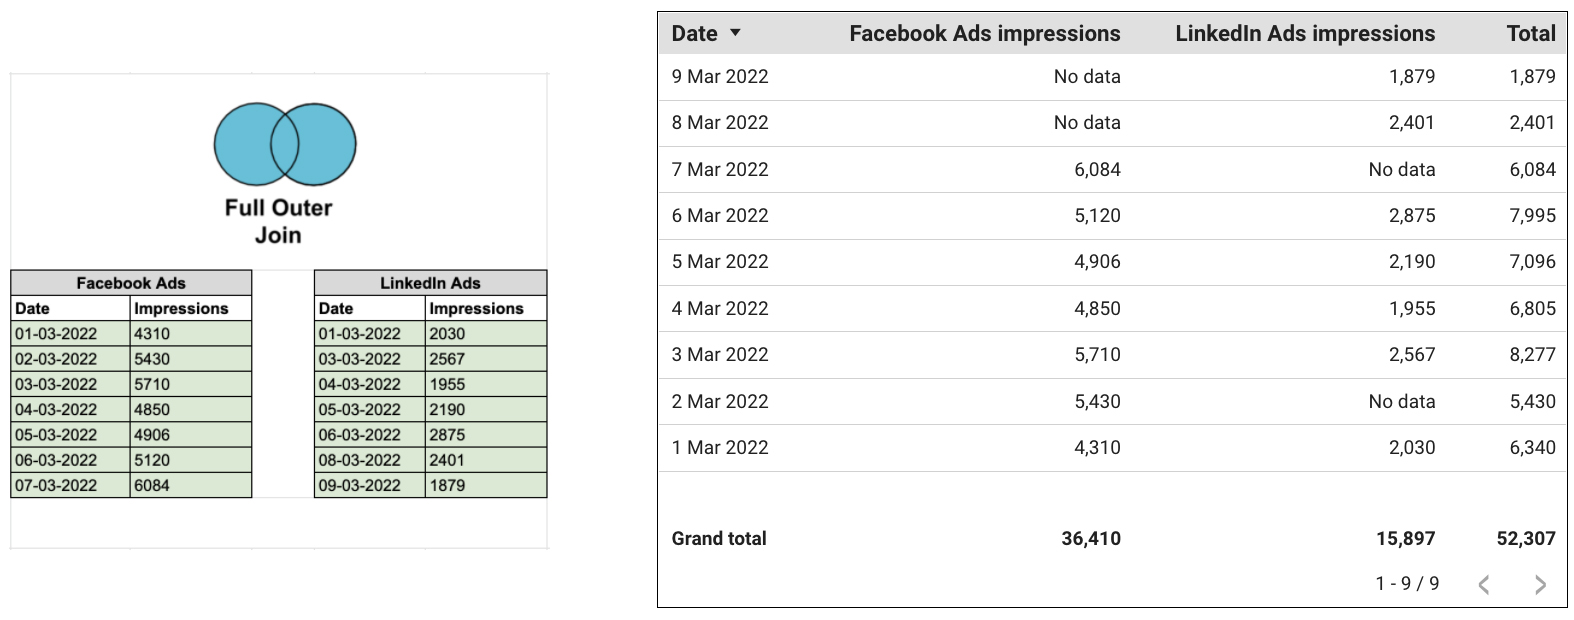
When blending data in Google Looker Studio, the full outer join operator is the most complete option. This option returns all rows, even if the rows aren’t matching. The power of the full outer join operator is shown in the image below.
The COALESCE function
When using the full outer join operator it’s important to know the COALESCE function. Basically this function returns the first non-missing value found in a list of fields.
Imagine the following situation:
We want to blend data of Facebook and LinkedIn Ads. We are using the same dimension in the join configuration as used in the above examples: date.
Because we want to see all the rows with data of both sources, Google Looker Studio says that we need to work with the date dimensions of Facebook as well as LinkedIn Ads. This is very confusing for dashboard users. This way the table is going to look like this:

The COALESCE function merges the two date dimensions into one dimension. In addition to this it uses the missing data from the other data source. This way, we can create a table like this:
