The option to select a certain period in your dashboard is valuable for many Google Looker Studio users. For this reason it’s very frustrating when the Date Range Control doesn’t work in your dashboards. Luckily there are solutions to make this option work again. Check out our four common solutions below.
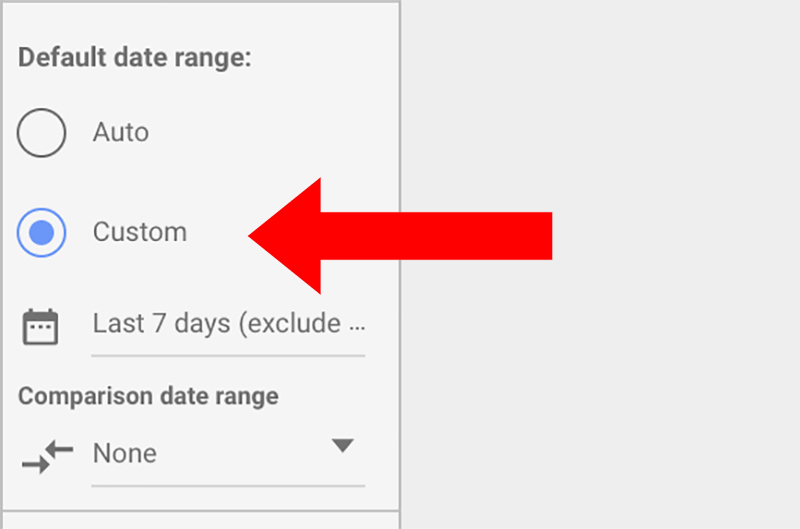
1. The default date range is set at custom
This could be obvious for many, but it’s the first important thing to check. Google Looker Studio gives us two different date range settings: ‘auto’ and ‘custom’. You can choose between these two options at every table, graph, scorecard etcetera. Make sure that you choose the ‘auto’ option. With ‘auto’ you can control the date range of the selected element with the Date Range Control.
2. The Date Range Dimension is not selected
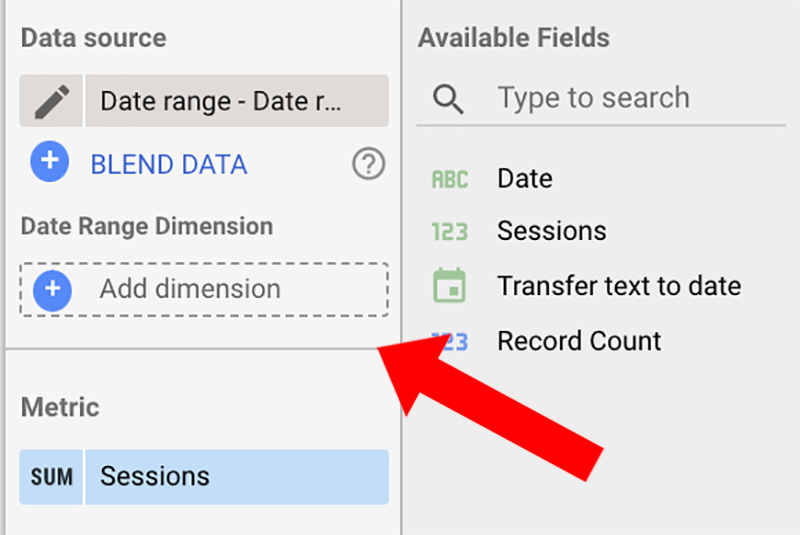
Sometimes you must select a ‘Date Range Dimension’. Google Looker Studio will give you the total of a dataset when you leave this dimension blank.
For example: we added a Google Spreadsheet source to our Google Looker Studio dashboard. In this spreadsheet the amount of sessions per day of our website (from januari until februari 2023) is visible. When we leave the ‘Date Range Dimension’ blank, we can only see the total of sessions. In this situation it’s not possible to see the number of sessions for a specific date.
Make sure you select a ‘Date type’ dimension at the ‘Date Range Dimension’ option. Once selected, you will see that the Date Range Control works for your table, graph, scorecard etcetera.
3. Using an incorrect Date Range Dimension type
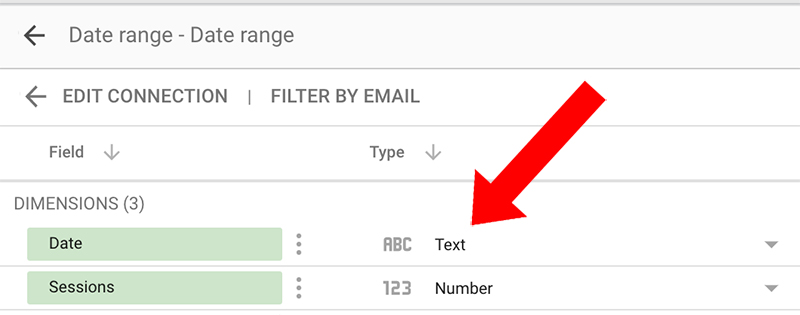
Sometimes Google Looker Studio interprets your data ‘wrong’. It sees for example ‘date type’ data as ’text type’ data. You can check this by clicking on: ‘Resource’, then ‘Manage added data sources’ and eventually ‘Edit’ (at the relevant source). Now you see all the dimensions and metrics of your selected source, scroll down to your date dimension. At the second column, known as ‘Type’, you can see what kind of type your date dimension has.
An example: In my Google Spreadsheet source I’m using the American date notation (month-day-year). For some reason Google Looker Studio interprets this as ’text type’ data, instead of ‘date type’ data. You can’t control the date range of for example a scorecard with a ’text type’ dimension. At this moment you’ve got two options to fix this:
- Adjust the structure of your date notation in the original source
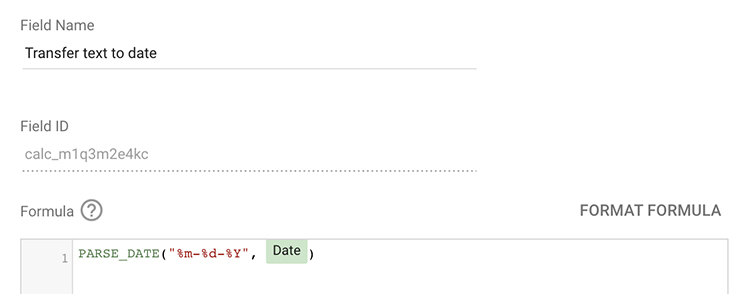
- Use a calculated field to transform a ’text type’ field into a ‘date type’ field. I will show you a method below.
Creating the right type: Date
Changing a ’text type’ field into a ‘date type’ field isn’t as easy as it looks. You must create a new calculated field to make this possible. In my earlier example I worked with the American date notation: 01-23-2021 (month-day-year). To transform this date notation you must use the PARSE_ DATE formula:
PARSE_DATE(“%m-%d-%Y”, select your dimension here)
Also check the Supported Format Elements For DATE for more information about the needed formula between the quotation marks.
4. There are too few bars set
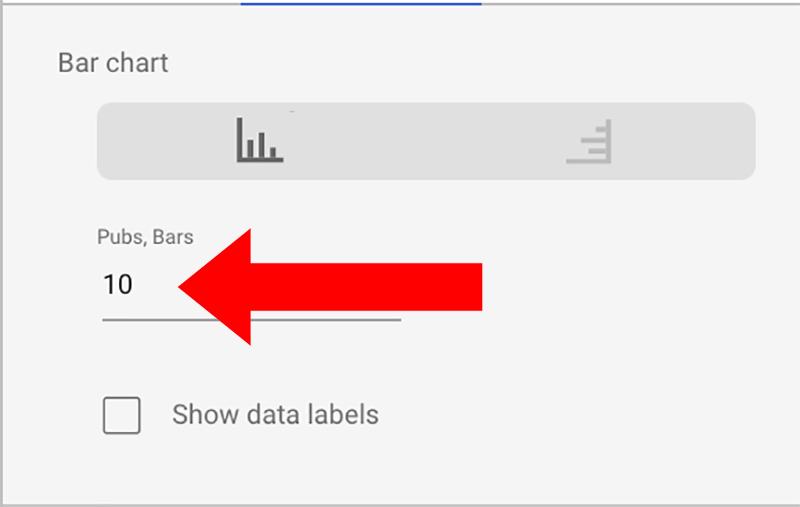
The last solution is an easy one. Select the graph which isn’t working with your ‘Date Range Control’. Then click on the ‘STYLE’ tab next to ‘DATA’ . Almost on top you can see ‘Pubs, Bars’, by default the number ten is here visible. Suppose you want to show a trend graph with data of twelve months (a whole year). To make this work, you must change the default number ten to twelve. Now it’s possible to see twelve bars, instead of ten.
